Product at a glance
Power quality monitoring and analysis
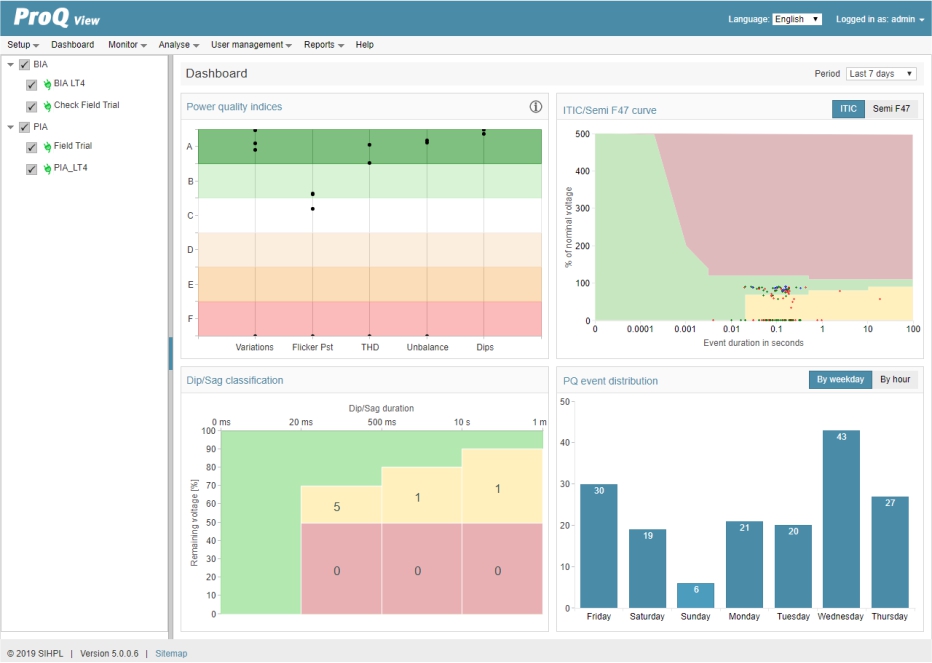
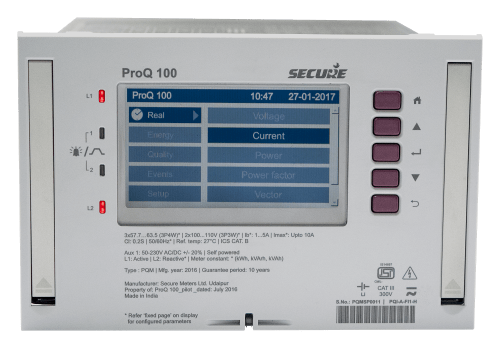
ProQ View – Get real-time power quality (PQ) data from
ProQ 100 meter. The data can be analysed for comprehensive monitoring of electrical and power quality parameters, and overall system health. Through real-time instantaneous values, energy and power quality parameters, ProQ View provides data in graphical and tabular formats; it also provides voltage compliance and harmonic reports.
Its intuitive, user-friendly dashboards let you quickly view your facilities’ PQ status and focus on the most urgent issues. Interactive graphics enable you to quickly identify the origin of events that are impacting your equipment. Comparative trends help you analyse root causes or identify issues early to take proactive decisions and actions. Detailed information about events helps you manage system loads and unexpected behaviours. Stored data and fault records can be analysed to detect threshold violations and can generate useful reports for quick decision making and better management.
 Power quality analytics